
Ciencia y Deporte. Vol. 9. No. 1, January-April, 2024, p.e233
Original article
DOI: https://doi.org/10.34982/2223.1773.2024.V9.No1.003
Reliable Diagnosis on the Application of Statistical Techniques in Physical Culture Education
Confiabilidad diagnóstica sobre la aplicación de técnicas estadísticas en la formación en Cultura Física
Confiabilidade diagnóstica na aplicação de técnicas estatísticas no treinamento de Cultura Física
Taimi Castañeda Rodríguez1*![]() , Abelardo López Domínguez2
, Abelardo López Domínguez2![]() , Victoria del Carmen Collazo
Frías1
, Victoria del Carmen Collazo
Frías1![]()
1The Manuel Fajardo University of Physical Culture and Sports. Havana, Cuba.
2University of Havana. Center for Higher Education Improvement Studies Havana, Cuba.
*Correspondence: taimicr@gmail.com
Received:09/04/2023
Accepted:10/24/2023
ABSTRACT
Introduction: Statistics plays a major role in Physical Culture professional education.
Knowing the current state of statistical techniques application in the subjects conditions the
establishment of parameters of variables to get characterizing tools during measurements. Their reliability
provides a scientific approach to the results.
Aim: To use reliable tools for the diagnostic of the current application of statistical techniques
in Physical Culture education.
Materials and methods: the methods used were theoretical, empirical, and statistical, such
as the analytical-synthetic, expert opinion, questionnaires for teachers and students,
and methodological triangulation. The mean of descriptive statistics was determined, along with
the variance. Besides, the frequency tables were constructed, which permitted the
characterization of the state of the art of the variable studied. The Cronbach alpha coefficient was
estimated according to the expert opinions, which proved the high confidence in the questionnaires.
Results: During the measurements, the existing shortcomings of the study variable were
confirmed, based on their simplest expressions and the results of estimations of the indicator's values,
along with the dimensions, and the variable.
Conclusions: The process corroborated the existing weaknesses in the application of
statistical techniques by students, through the particular subject, as well as teacher flaws, to
enhance proper statistics use in the different graduate profiles.
Keywords: Cronbach alpha, instruments, statistical techniques.
RESUMEN
Introducción: la aplicación de la estadística tiene gran importancia en la formación del
profesional en Cultura Física. Conocer el estado actual de la aplicación de sus técnicas desde la
asignatura donde se imparten, condiciona la parametrización de la variable para obtener instrumentos que
la caractericen durante la medición. La confiabilidad de estos les aporta cientificidad a los resultados.
Objetivo: diagnosticar con instrumentos confiables, el estado actual de la aplicación de
técnicas estadísticas en la formación en Cultura Física.
Materiales y métodos: se aplicaron métodos del nivel teórico, empírico y estadístico entre
los que se pueden nombrar: el analítico-sintético, criterio de experto, cuestionarios a profesores
y estudiantes, triangulación metodológica. De la estadística descriptiva se determinó la media,
la varianza y se construyeron tablas de frecuencias, todos ellos permitieron caracterizar el
estado actual de la variable en estudio. El cálculo del coeficiente Alpha de Cronbach a partir del
criterio de los expertos, evidenció la alta confiabilidad de los cuestionarios evaluados.
Resultados: en el proceso de medición se pudo constatar las deficiencias existentes en
la variable de estudio desde sus expresiones más simples, amparados los hallazgos mediante
el cálculo de los índices de los indicadores, las dimensiones y la variable.
Conclusiones: todo el proceso reafirmó las debilidades existentes en la aplicación de
técnicas estadísticas por los estudiantes desde la asignatura donde se imparten y las
limitaciones de los profesores para potenciar su uso en los diferentes perfiles de egreso.
Palabras clave: Alpha de Cronbach, instrumentos, técnicas estadísticas.
RESUMO
Introdução: a aplicação da Estatística é de grande importância na formação de profissionais
de Cultura Física. Conhecer o estado atual da aplicação das suas técnicas a partir da
disciplina onde são lecionadas, condiciona a parametrização da variável à obtenção de instrumentos
que a caracterizem durante a medição. A confiabilidade destes confere cientificidade aos resultados.
Objetivo: diagnosticar, com instrumentos confiáveis, o estado atual da aplicação de
técnicas estatísticas no treinamento de Cultura Física.
Materiais e métodos: foram aplicados métodos teóricos, empíricos e estatísticos, entre
os quais podemos citar: analítico-sintético, critérios de especialistas, questionários
para professores e alunos, triangulação metodológica. A partir da estatística descritiva
foram determinadas a média e a variância e construídas tabelas de frequência, que
permitiram caracterizar o estado atual da variável em estudo. O cálculo do coeficiente Alfa de
Cronbach com base nos critérios dos especialistas mostrou a alta confiabilidade dos
questionários avaliados.
Resultados: no processo de mensuração foi possível verificar as deficiências existentes
na variável de estudo a partir de suas expressões mais simples, sustentando os achados
através do cálculo dos índices dos indicadores, das dimensões e da variável.
Conclusões: todo o processo reafirmou as fragilidades existentes na aplicação de
técnicas estatísticas pelos alunos da disciplina onde são ministradas e as limitações dos professores
para promover a sua utilização nos diferentes perfis de graduação.
Palavras-chave: Alfa de Cronbach, instrumentos, técnicas estatísticas.
INTRODUCTION
At present, many countries, including Cuba, have an increasing number of research studies about statistics teaching to tackle an existing contradiction. On one hand, there is greater applicability of statistics, and on the other, the training received in higher education is lacking. Most degrees deal with topics from descriptive statistics to inferential statistics, but no work is done to prepare students to obtain better data sets, and use a great deal of data input and the best interpretation of the results using statistical software for information processing (Pérez et al., 2018, p. 341).
In recent years, the application of statistics has undergone an exponential growth. It owes to its universality in the different areas of knowledge, and its usefulness in research processes. The solution to learning proper statistical use techniques has not been conceived as an act of content repetition, but the power to compile or measure data sets, being capable of using the most suitable statistical techniques for result processing and analysis.
This study takes place at the Manuel Fajardo University of Physical Culture and Sports (UCCFD), which provides education in sports, physical education, therapeutical physical culture, and recreation, knowing the value of its social mission, and the significance of statistical technique application in student research projects.
In this context, authors like Castañeda, Morales, and López (2021), Castañeda, López, and Morales (2021), and Castañeda et al. (2022) stressed the usefulness and applicability of statistical techniques as research tools. Hence, a diagnostic was performed on first-year students in the regular course, and teachers of Computer Science and Data Analysis, at the UCCFD. Since the implementation of syllabus E, the above subject includes contents of statistical techniques and their application in the four graduate profiles.
The identification and operativeness of this variable are major tasks to perform an effective process. This variable is known as the application of statistical techniques in the Physical Culture professional education. It is defined as the process that permits managing, associating, analyzing, interpreting, comparing, and representing data sets related to the four graduate profiles (therapeutical physical culture and prophylactics, recreation, physical education, and sports), on the statistical conceptual bases mastered by students, in keeping with their academic-social setting. The variable was broken down into three dimensions and nine indicators.
Obtaining instruments with adequate internal consistency is a challenge for researchers. An important number of scientific research studies show the absence of rigor, particularly because of the lack of validation of the instruments used (López et al., 2019). Accordingly, the purpose of this paper is to use reliable tools for the diagnostic of the current application of statistical techniques in Physical Culture education.
MATERIALS AND METHODS
The aim of this research demands exploration and solution of social problems based on the contribution of practical results using reliable tools, as well as the application of statistical techniques by first-year students in the regular course, based on the teaching-learning process of subject Computer Science and Data Analysis, following their teacher's actions to facilitate the process.
Two questionnaires were conducted for measurements, and though their original features were kept, a test was run to confirm the reliability and validity of the results achieved. The test was the Cronbach alpha coefficient. This method is thought of as a simple and reliable form of validating a scale, and a way of quantifying the existing correlation in it, which is the correlation average of items constituting part of an instrument.
That way, the instrument's internal solidity can be determined, considering that all the items in each questionnaire use the same measurement scale. The coefficient is calculated from the variance of individual items and the variance from the sum of the items evaluated, through SPSS (v.25) (Statistical Package for the Social Sciences).
To validate the reliability of the questionnaires, a number of experts were selected. From them, 19 of the 23 experts considered initially were chosen, from the areas of data analysis, statistics, and research methodology. Moreover, the selection criterion was their level of knowledge, depending on their experience in higher education for over 8 years, and their knowledge of pedagogy and didactics.
The student questionnaire comprised 12 items, three of them evaluated the reproductive assimilation level (Dimension 1), the fourth level of productive assimilation (Dimension 2), and five included the creative assimilation level (Dimension 3). The teacher questionnaire has six items, of which two were included for each dimension, focusing on teacher actions in favor of learning strategies that contribute to the application of statistical techniques.
To assess the instruments for the study, a Likert-type five-point scale was designed. The criteria used for expert evaluation of the behavior of the indicators in the surveys were inappropriate (1 point); little appropriate (2 points); appropriate (3 points); quite appropriate (4 points); and very appropriate (5 points). Consequently, to determine the diagnostic group, 234 first-year students from the regular course were selected, along with 7 teachers of the subject of Computer Science and Data Analysis. All of them made up the research population.
Among the methods used, the analytical synthetic was used to understand the information studied and establish the multiple relations between the study variable, its dimensions and indicators, and the items in each instrument. The expert opinion method was used to select, based on their knowledge of educational practice, the professionals who would evaluate the internal solidity of the questionnaires. Methodological triangulation was used to eliminate possible bias of the results and contrast the findings of different instruments applied.
Descriptive statistics was used along with mean estimation, variance, and frequency distribution tables. Besides the Cronbach alpha coefficient was calculated to determine the reliability of the questionnaires before their application. All the procedures could be improved according to the results achieved following the alpha coefficient calculation upon elimination.
RESULTS AND DISCUSSION
Pedroso et al. (2021) said that the alpha coefficient varies between 0 and 1. Value 0 represents null reliability, whereas 1 is full reliability. This research matches Pedroso (2021), who classified the Cronbach alpha coefficient according to the following limits: very low reliability: α ≤ 0.30; low reliability: 0.30 < to ≤ 0.60; moderate reliability: 0.60 < to ≤ 0.75; high reliability: 0.75 < to ≤ 0.90; very high reliability: α > 0.90.
The reliability of the surveys presented was determined through the general Cronbach alpha coefficient calculation, to estimate the existing correlation between them and estimate poorly solid items, or items that moved away from aspects that influenced the application of statistical techniques in Physical Culture professional education.
Upon the application of the questionnaires and information processing, a statistical analysis was performed to determine the alpha coefficient value. The calculation of the mean, rank, typical deviation, and variance, shows the quality of the items according to the values achieved. Figure 1 (student survey) and Figure 2 (teacher survey) show the results (Figure 1).
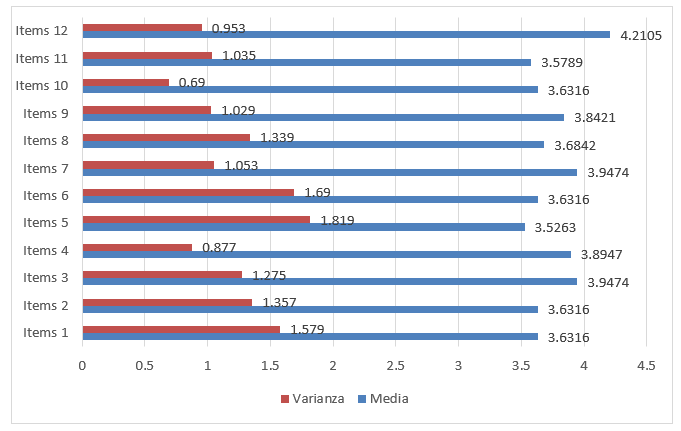
Fig. 1. - Results of calculations of the arithmetic mean and variance of the items evaluated by the experts in the questionnaire for students
The values observed for the mean were above 3.5, indicating that according to the Likert scale assumed, the experts considered the items presented as appropriate to quite appropriate. Items three, seven, and twelve showed positive average results. Concerning variance, the highest concentration of coinciding responses was found in questions four, ten, and twelve, indicating solid responses. A contrast of the results showed that questions four and twelve had the highest number of coinciding results, according to the evaluators (Figure 2).
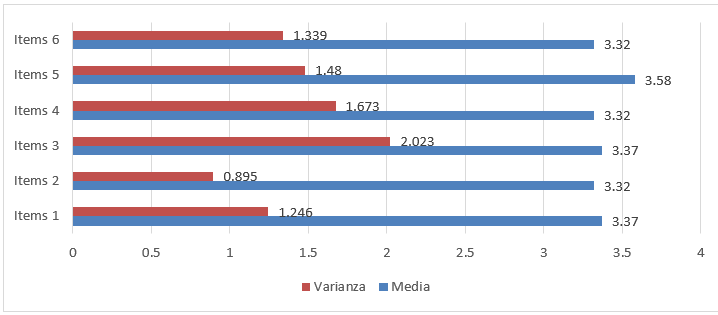
Fig. 2. - Results of calculations of mean and variance of the items evaluated by the experts in the questionnaire for teachers
According to expert assessment in the teacher survey, the values observed in each item related to the mean, were above 3.3, indicating that they were thought of as appropriate with a higher trend in the questions asked; item No. five showed the best results. The rest showed very insignificant differences, with coincidences in items two, four, and six, and one and three. The greatest coincidence in the results was observed in question two, whereas item three had the lowest coincidence, thus suggesting a review.
The value achieved using the Cronbach alpha coefficient in the student and teacher surveys (twelve and six items, respectively), showed values of 0.801 and 0.872, respectively, which determined, based on the scale, high reliability for application.
The survey results were analyzed through the assessing scale described by Collazo (2016) adjusted for this study, which has three levels: 1 (Low), 2 (Mid), and 3 (High). The first level represents the undesired results, the second shows the results far from desired, and the third one, the desired results.
The analysis of dimensions and indicators, as well as the analysis of variables, helped structure the study. The main results observed in the student survey showed some flaws in the three dimensions, since in none of the cases a level-3 indicator was observed (H), in more than 85 % of the students. The table show the results achieved using this instrument (Table 1).
Table 1. - Initial results of student survey indicators
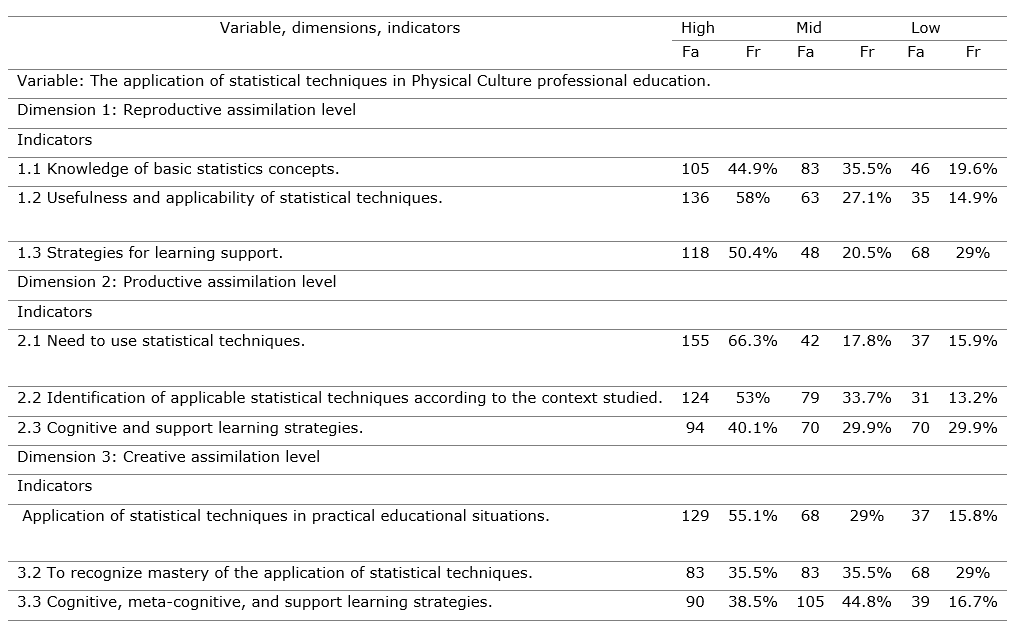
Note: Fa-Absolute frequency. Fr-Relative frequency.
One of the most affected indicators was 3.2, related to knowledge about the mastery of the application of statistical techniques, at level 1 with 68 students (29 %) (L).
Likewise, students showed problems with indicators 1.2, 1.3, and 2.3, in relation to recognizing the usefulness of statistical techniques and their possibilities to acquire them through learning support strategies and cognitive strategies for learning support in the same system of actions. Hence, these indicators were at the lowest level, with 14.9 % (35), 29 % (68), and 29.9 % (70), respectively.
It showed the poor knowledge of students about this particular topic, and their little possibilities of performing learning actions. Accordingly, the cognitive, meta-cognitive, and learning support strategies are also at level 1 (L) thanks to the close relationship between knowing about a topic and being able to deploy application actions. The analysis of these results revealed a very critical indicator: 2.1, at level 2 (M), with 66.3 % (155), about the need to use statistical techniques, thus evidencing the recognition of their importance in education, depending on their application needs.
The teacher survey measured three indicators referred to the learning strategies, to know they were implemented for students to use statistical techniques. Table 2 shows the frequencies obtained in the measurements.
Table 2. - Initial results of teacher survey indicators
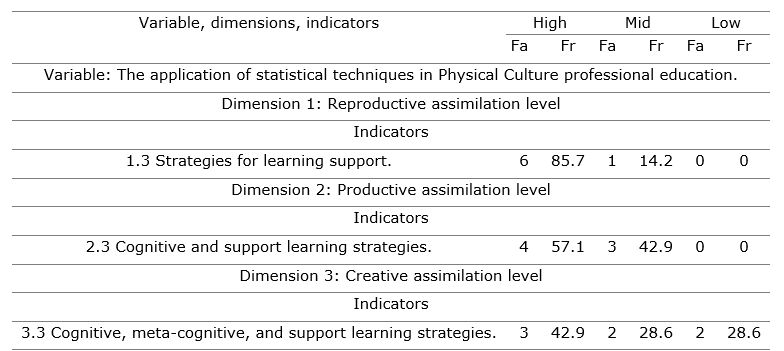
The indicator learning support strategies showed that 85.7 % (6) of the teachers were at level 3 (H), 14.2 % (1) were at level 2 (M), and no frequency was found at level 1 (L). It permitted the location of level 3 indicator (H) and demonstrated that most teachers favor this type of strategy.
The indicator cognitive strategies and learning support strategies showed that 57.1 % (4) of teachers were at level 3 (H), 42.8 % (3) were at level 2 (M), and no frequency was found at level 1 (L). Therefore, the indicator was finally at level 2 (M). These results suggest that some teachers encourage their students to use their knowledge of statistical techniques in practical situations linked to their graduate profiles, with equal relevance to their motivations, feelings, and ways of addressing them.
The indicators cognitive, meta-cognitive, and support strategies were at level 3 (H), with 42.9 % of the teachers (3), which means it did not come close to the expected values to evaluate the indicator adequately, since it was below 57 %, at the boundary of level 2 (M). Hence, this indicator is placed at level 1 (L), while the percentages at levels 2 and 3 did not affect the results.
For the final evaluation of indicators, dimensions, and the variable, the three levels were considered parameters based on the following scales:
A scale to evaluate indicators based on their results by instruments
A scale to evaluate dimensions based on their results by instruments
A scale to evaluate the variable
The values achieved were useful for evaluating the indicators, dimensions, and variables (Table 3).
Table 3. - Evaluation of indicators, dimensions, and variables based on the frequencies calculated by instruments
The analysis of these results revealed that dimension 1 (reproductive assimilation level), dimension 2 (productive assimilation level), and dimension 3 (creative assimilation level) were at level 1 (L), with undesired results; 77.7% of the calculated frequencies corroborated it. Accordingly, the evaluation of variable application of statistical techniques in Physical Culture professional education was placed at level 1 (L). These results did not meet the expected objectives in the discipline and subject involved in statistical technique application.
To reduce bias and raise understanding of the findings, the results were subjected to methodological triangulation. Accordingly, the indicator indexes of each instrument used were calculated. This procedure revealed the index describing the behavior of dimensions and the variable studied, according to the results achieved previously.
Cerezal and Herrera (2010) noted that
the "index" is the value that integrates the data from different items within the same indicator. The index is also used to get the value of a dimension, based on its indicators, or the value of the variable resulting from the integration of values or indexes of their dimensions (p.38).
These values are used to "calculate the weighted mean, which is based on the weighted criterion and significance of each subject's opinion" (Cerezal & Herrera, 2010, p. 44). That way, the following weighted criterion was assumed:
The indexes of each dimension and variable were calculated based on the weighted criteria.
Overall index calculation (OI) of indicators
Overall index calculation (OI) of dimensions
Overall index calculation (OI) of the variable
The values of every level set when turning the indicators into parameters were used to analyze the results, and then the following scale was used to classify the value of the indexes achieved in the indicators, dimensions, and variables:
The overall index calculations evidenced their shortcomings, with values below 1, which corresponds to level 1 (L). The indicators 1.2 and 3.2 showed the highest problems, with 0.51 and 0.54, respectively. According to the results, the overall index of each dimension varied between 0.60 and 0.67, al level 1 (L). The variable's overall index was 0.64, at level 1 (B), like the dimensions and indicators, showing undesired results.
Hence, the variable studied was characterized by the following problems:
The implementation of several scientific methods enhanced the reliability of the outcomes; implementing these strategies based on the Cronbach alpha coefficient to corroborate the internal solidity of the surveys, offers added value to this research. Some authors (Brown, 2009; Drost, 2011; Viladrich et al. 2017, cited in Rodríguez & Reguant, 2020) pointed out certain matters associated with underestimating or overestimating the reliability of the instrument in terms of proper use and interpretation, as well as the number of items in the surveys. Ventura and Peña (2021) referred to the results from a simulation in program R, which examines the alpha coefficient, and highlighted a value above 0.70, as not sufficient to ensure the reliability of a measuring instrument, adding that the correlation matrix should be analyzed, along with its average, standard deviation, and number of items.
Other authors (Toro et al., 2022) stressed the alpha coefficient as the most widely used statistics, and how important it is for test design, especially tests with multiple items, with quality results so far. Several studies have shown that in Likert-type scales, the results are more reliable when five or more response categories appear, and when the number of subjects is sufficient. All these aspects were considered as well.
An analysis of the shortcomings and visualization of the possible causes made the researchers coincide with the idea stated by Castañeda et al. (2022), who said that the educational process must tackle understanding, interpretation, evaluation, and communication of the results, based on elementary statistical knowledge in the disciplines of the degree. Each professional procedure must have a solid scientific base, backed by responsible scientific work, using techniques that characterize the processes or variables studied.
However, most students acknowledge that statistics is based on procedures derived from mathematics only used in their lessons. From a learning perspective, it is not essential for professional practice; a solution could be found in the findings of Roig et al. (2022), who suggested that statistics be linked to the other subjects through professional practice, having a professional research approach. It may be a possible solution, though first-year students at UCCFD did not show strengths in the application of statistical techniques, which did not correspond to the guidelines for basic professional skills in Syllabus E.
CONCLUSIONS
The Cronbach alpha coefficient brought about the necessary reliability of the instruments, following the criteria from a group of experts who classified them as appropriate to measure the current state of the application of statistical techniques in Physical Culture professional education.
The outcomes provided by the surveys (upon checked reliability) showed that the current state of the variable was affected, having undesired results, thus suggesting a review of the shortcomings to state a scientific result according to the solution given by macro research.
BIBLIOGRAPHIC REFERENCES
Castañeda, T., Morales, A. M., & López, A. (2021). La asimilación de las técnicas estadísticas: una necesidad en la formación del profesional de Cultura Física y Deporte. PODIUM. Revista de Ciencia y Tecnología en la Cultura Física, 16 (2), 451-466. https://podium.upr.edu.cu/index.php/podium/article/view/1017
Castañeda, T., López, A., & Morales, A. M. (2021). Asimilación: componente esencial en el aprendizaje de la Estadística del profesional cubano de Cultura Física. En R. M., Jiménez & E. Verdecia (comp), Educación en Cuba. Criterios y experiencias desde las Ciencias Sociales (pp. 193-208). Publicaciones Acuario, Centro Félix Varela. https://biblioteca.clacso.edu.ar/Cuba/flacso-cu/20210322115651 /Educacion-Cuba.pdf
Castañeda, T., López, A., Morales, A. M., & Collazo, V. C. (2022). La asimilación de las técnicas estadísticas en la formación del profesional en Cultura Física y Deporte. PODIUM, 17 (1), 369-386. https://podium.upr.edu.cu/index.php/podium/article/view/1214/html
Cerezal, J., & Herrera, E. (2010). Investigación Educativa en la Escuela. Lima, Perú: San Marcos.
Collazo, V. D. C. (2016). La integración de contenidos en el proceso de enseñanza-aprendizaje de la Matemática para la formación profesional del técnico medio en la especialidad Zootecnia-Veterinaria. La Habana: Universidad de Ciencias Pedagógicas" Héctor Alfredo Pineda Zaldívar.
López, R., Avello, R., Palmero, D., Sánchez, S., & Quintana, M. (2019). Validación de instrumentos como garantía de la credibilidad en las investigaciones científicas. Revista Cubana de Medicina Militar, 48(2(Sup)). https://revmedmilitar.sld.cu/index.php/mil/article/view/390
Pedroso, L. M., Diez, T., & López, A. (2021). Estructuración sistémica de los contenidos de la matemática en la ingeniería utilizando la habilidad usar asistentes matemáticos. Varona. Revista Científico Metodológica, (74), 64-74. http://scielo.sld.cu/scielo.php?script=sci_arttext&pid=S1992-82382022000100064&Ing=es&tlng=es.
Pérez, Y. T., Crespo, T. P., & López, R. (2018). Análisis estructural prospectivo sobre la enseñanza de la Estadística en las carreras universitarias. Revista Conrado, 14 (Supl.1), 340-349. https://scielo.sld.cu/scielo.php?script=sci_arttext&pid=S1990-864420180000500340&Ing=es&tlng=es
Rodríguez, J. & Reguant, M. (2020) Calcular la fiabilitat d´un qÜestionari o escala mitjancant I´SPSS: el coeficient alfa de Conbach. REIRE Revista d'Innovació i Recerca en Educació, 13 (2), 1-13. https://doi.org/10.1344/reire2
Roig, S., M, J. L., Mena, J. A., & Estrada, A. (2022). La enseñanza-aprendizaje de Estadística para ingenieros informáticos, centrado en el método de proyectos. Mendive. Revista de Educación, 20 (2), 602-617. Epub 02 de junio de 2022. http://scielo.sld.cu/scielo.php?script=sci_arttext&pid=S1815-76962022000200602&lng=es&tlng=es
Toro, R., Peña, Avendaño, B. L., M., Mejía, S. & Bernald, A. (2022). Análisis empírico del Coeficiente Alfa de Cronbach según Opciones de Respuestas, Muestra y Observaciones Atípicas. Revista Iberoamericana de Diagnóstico y Evaluación, 2 (63), 17. https://www.redalyc.org/journal/4596/459671926003
Ventura, J., & Peña, B. N. (2021). El mundo no debería girar alrededor del alfa de Cronbach eH ,70. Adicciones, 33 (4), 369- 371. https://doi.org/10.20882/adicciones.1576
Conflict of interest statement:
The authors declare having competing interests.
Author contribution statement:
The authors have participated in the redaction of the manuscript and the documentary review.
![]()
This paper is distributed under the terms of the Licencia CreativeCommons (CC) 4.0. (CC BY-NC-SA 4.0)
Copyright (c) 2024
Taimi Castañeda Rodríguez, Abelardo López Domínguez, Victoria del Carmen Collazo
Frías